Analyzing Your Fantasy Football Season with Python
January 11, 2023A step-by-step tutorial on how to measure the difference between ESPN projected points and actual points scored each week in your league

For this project we’re going to focus on every Fantasy Football owner’s biggest nemesis, the ESPN weekly projections.
We’ve all been there before. You have a hunch that Mike Evans is going to go nuclear for you in your Fantasy Football championship but ESPN projects Garrett Wilson to outscore him. After a lot of internal back and forth you decide to play it safe and listen to the numbers, only to lose the championship by a handful of points.
Not every owner listens to the ESPN projections of course. With the help of Python we can do a better job quantifying just how good (or bad) the weekly ESPN projections were for each team, position and player. This can help identify which players were overvalued and undervalued each week and over the course of the season.
Before we dive in, please know that this project was heavily influenced by Steven Morse (aka stmorses) work, which I recommend every Python Fantasy Football fan dive into. You can find his blog posts here and his helpful github repo here. I am merely standing on the shoulder of a giant.
At a high level we will:
- Use Python requests to get data from the unofficial ESPN Fantasy Football API
- Save that data into a pandas dataframe so we can have some fun with it
- Analyze and plot the data in unique ways to get a feel for ESPN Projections for various fantasy teams
Prerequisites:
- ESPN Fantasy Football League
- Python
- Pandas
- Jupyter Notebook (optional)
- Matplotlib (optional)
As always you can watch this post instead:
Making a Request to the ESPN Fantasy Football API
Request Parameters
There are three parameters you need to include in your get request to espn.com. The url, the cookies and the scoringPeriodId.
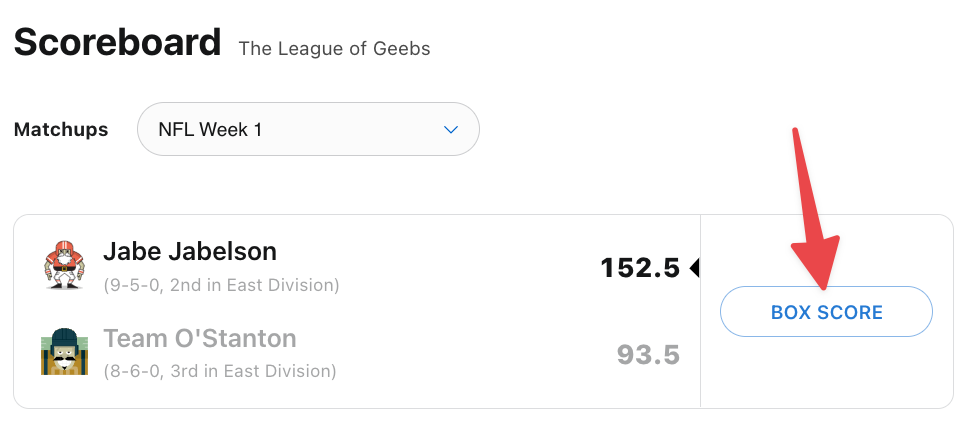
To get this info, log into your ESPN account and visit your fantasy league. Access the history tab from the league dropdown menu and click on “View Scoreboard”
Select any given Box Score from any given week. In this example I went with Week 1 from the 2021 Season.
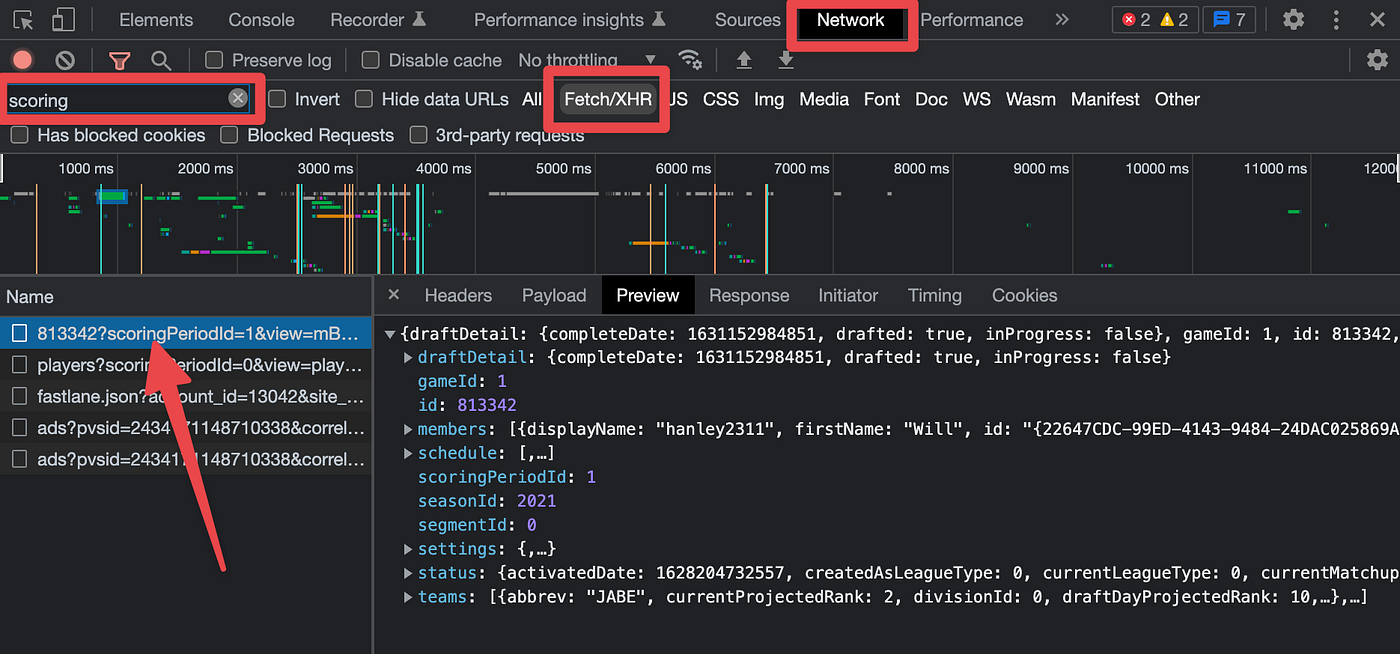
Once you’re on the Boxscore page you can use the Chrome developer tools to inspect the page via the Network tab. You’re looking for a specific request which includes a string with the league id following by scoringPeriodId. You can find it by selecting the Fetch/XHR tab and searching for “scoring.”
Assuming you’re in a private league, you’ll need to navigate over to the Headers tab to get the cookie info and URL.The two cookies you are after will be in that big text blob.
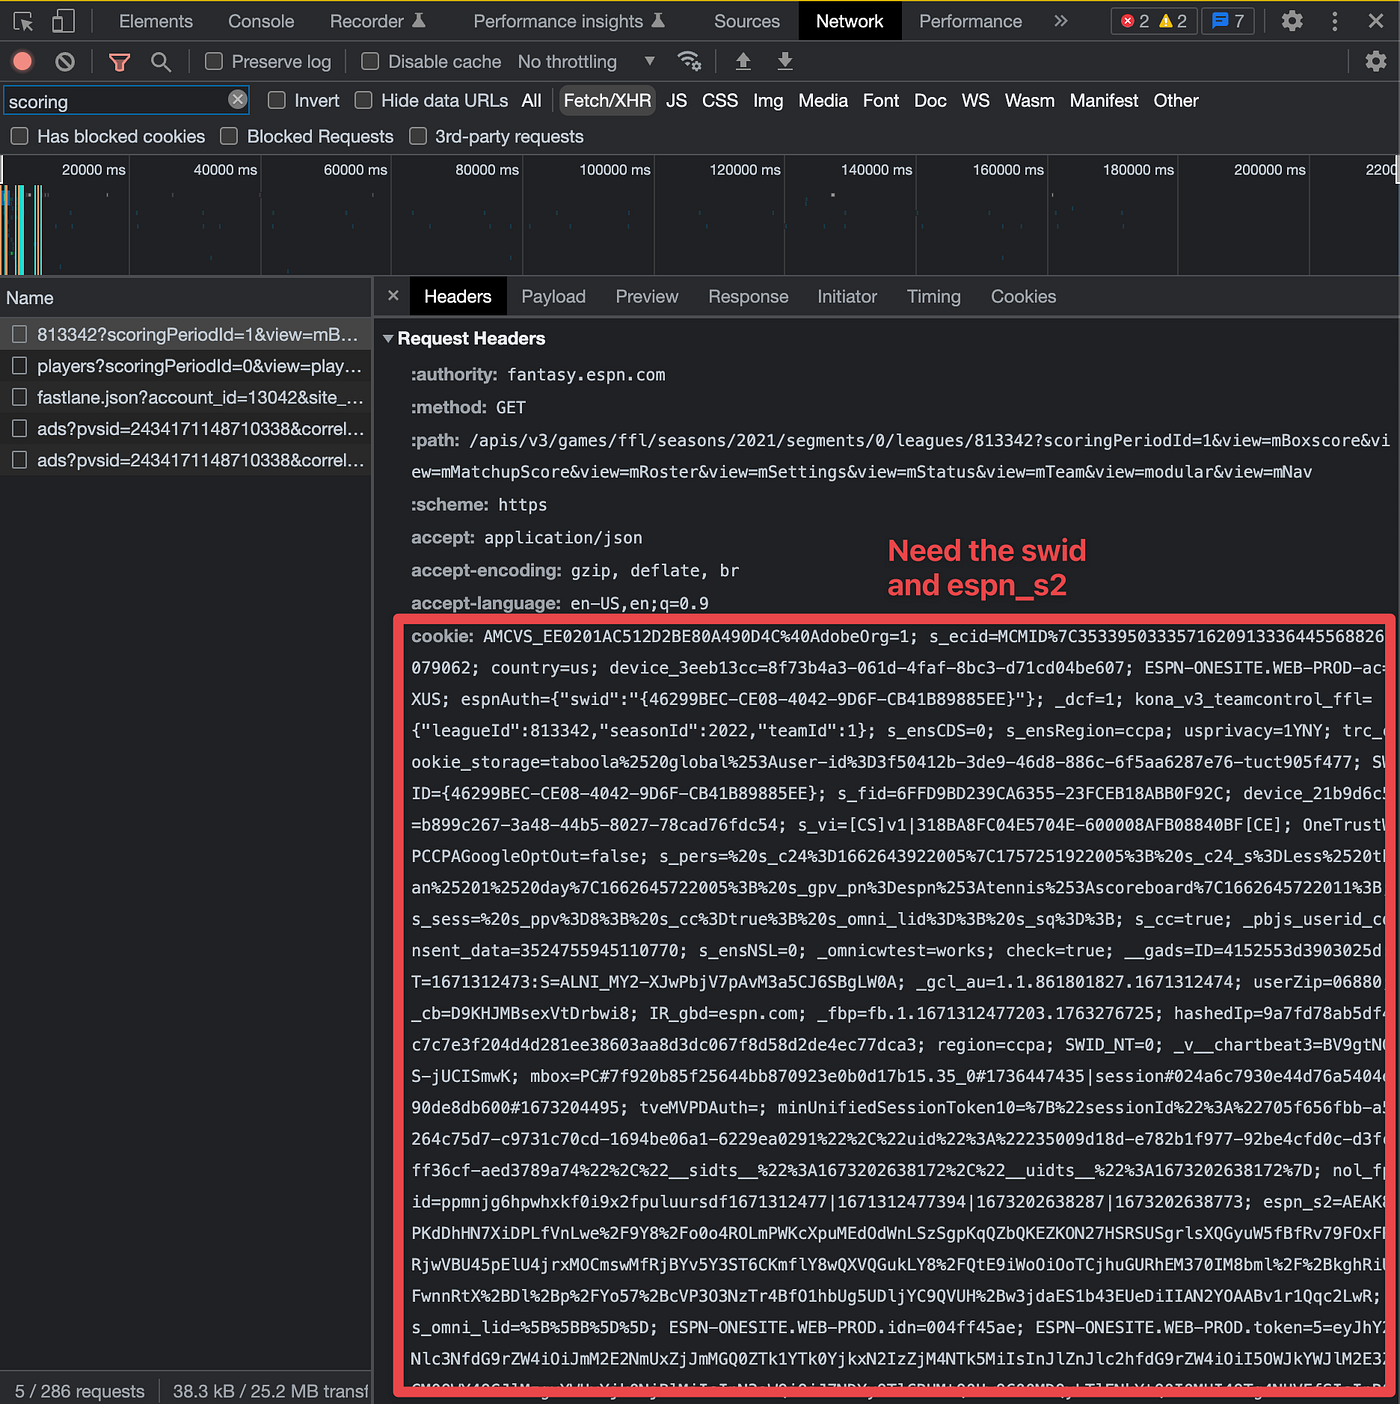
They will look something like:
espnAuth={“swid”:”{YOUR-LONG-SWID-CODE-HERE}”}
espn_s2=AN_EVEN_LONGER_ESPN_S2_CODE_THAT_YOU_NEED_TO_COPY_EXACTLY;swidis a string containing a unique identifier.espn_s2is a string containing another unique identifier.
Save these as variables so you can just reference the variables instead of the really long text strings each time you make an API call.
# drop these into variables which we will use in the API call
swid = ‘{46299BEC-CE08–4042–9D6F-CB41B89885EE}’
espn_s2 = ‘AEBZoZ5pskd4UFxLIVgLTWjp8HFIwSn18Xhj7K7beiMLDnVmEj35PviMGsDwr8JwxFkVL5Szm%2FDNg5XL4wBkIh1HbVjZfZAe6%2Br7CmM996QrcsNAU0Sir1DBP7THgiEz8My9wXJQPaHpPMYHFeBVeHaO5uQUwDPcKaxc1xg5bHc1MCBXioQ1uGF7JQ5KYHK%2Bz4uRth1Obnfr1gP9KUBM0xgiVk4McqHFW0WtMibtMRhTBKlU%2BNaWHe6LSuCWG8Au6PcQ90C%2BNEpLO7VJd9JeXStA’
league_id = ‘813342’
You need both of these to authenticate with your private league so you can make a call to the API. To make the call you also have to pass in the Request URL which you can grab from the Headers tab.
Save it into a url variable and and format it so it’s easy to swap variables, such as the season or league_id, in and out. You also don’t need the entire URL, only up to view=mMatchup&view=mMatchupScore
url = ‘https://fantasy.espn.com/apis/v3/games/ffl/seasons/{}/segments/0/leagues/{}?view=mMatchup&view=mMatchupScore'.format(season, league_id)Next you can pick a season and a week to experiment with. Save these to a season and week variable:
league_id = ‘813342’
season = ‘2021’
week = 1
league_idis a string containing the ID of your fantasy football league.seasonis a string containing the season for which data is being requested.weekis an integer representing the week of the season for which data is being requested
Now you are ready to send a request! Pass it into requests.get() and store the response from the API in the r variable. Then call ther.json() method to parse the JSON data in the response, and store the resulting dictionary in the espn_raw_data variable.
r = requests.get(url,
				params={‘scoringPeriodId’: week},
                cookies={“SWID”: swid, “espn_s2”: espn_s2})

espn_raw_data = r.json()
If we print the espn_raw_data we will see a big json blob.
If you head back to the network tab the espn_raw_data will look exactly like the Response.
You’re in business.
Saving JSON Response to a Pandas Dataframe
Accessing Nested JSON Data
Within the big JSON response is a goldmine of data. You know for sure you want to get the projected and actual fantasy points for each player, but there are additional columns of data you’ll want to save within your dataframe.
Your dataframe should include the following columns:
columns = [
	'Team',
    'Player',
    'Slot',
    'Projected',
    'Actual'
    ]
It will be a similar approach to get each value for each column but since the data is nested at different levels, you have to pay close attention.
Start with the team. If you were to uncurl the teams within the Preview tab youe will see each team in your fantasy football league. Below you can see each of the 12 teams in my league.
To access this same teams info within the espn_raw_data, run the following:
# get a single team
team = espn_raw_data[‘teams’][0]
team_id = team[‘id’]
This grabs the team in the first row and the id for that team. Since an id is just an integer, you’ll want to create a team_abbrev dictionary with the id as the key and the team names as the values.
# change depending on your league
team_abbrev = {
	1: ‘JABE’,
	2: ‘SAM’,
	3: ‘MAX’,
	4: ‘AISLEMEN’,
	5: ‘OSTANT’,
	6: ‘REILS’,
	7: ‘HAN’,
	8: ‘WEST RD’,
	9: ‘POWELL’,
	10: ‘CONOR’,
	11: ‘MURPH’,
	12: ‘BILL’,
	}
Now you can replace the id with the team_abbrev so it is more readable.
team_owner = team_abbrev[team_id]Each team has a roster with entries. These entries represent the 17 players on the teams roster. It number will differ depending on your league settings.
Within an entry, you can get the player and slot data needed for those columns. Print them out in a for loop to get a feel first:
# loop over every player on the teams roster
for player in team[‘roster’][‘entries’]:
	print(player[‘playerPoolEntry’][‘player’][‘fullName’])
    print(player[‘lineupSlotId’])
Like the teamId, the lineupSlotId doesn’t mean much to the naked eye. You can make it easier to consume by creating a dictionary for the eligible positions. This will allow you to group by teams and positions later on. Within the positions, there is also an option for “Bench.” This will be important later on if you only look at projections for starters.
# make sure these map to your roster settings
# we have a two qb league but QB2 is an OP incase you can roster 2 QBs in a we
ekeligible_positions = {
	0 : ‘QB’,
    2 : ‘RB’,
    4 : ‘WR’,
    6 : ‘TE’,
    7 : ‘OP’,
    16: ‘D/ST’,
    17: ‘K’,
    20: ‘Bench’,
    23: ‘Flex’
    }
If you include this in the for loop then you should be able to see a full roster with all the data you need.
# loop over every player on the teams roster
for player in team[‘roster’][‘entries’]:
	print(player[‘playerPoolEntry’][‘player’][‘fullName’])
    print(player[‘lineupSlotId’])
    lineup_slot = player[‘lineupSlotId’]
    print(eligible_positions[lineup_slot])
Now you’re ready to move on to accessing the projected and actual points.
Projected & Actual Points
In order to find the total Projected and Actual points for each player for each week, you need two specific pieces of info from the long JSON response.
Within the preview tab, you can navigate deeper and deeper into the data. You eventually will find your way to a specific player’s stats. Within those stats, there are specific values to pay attention to in order to get the weekly projected points and actual points.
ScoringPeriodId= NFL weekappliedTotal= total pointsstatSourceId= boolean to differentiate projected vs actual
You’ll notice the actual and project points total on espn.com maps to the appliedTotal only when the scoringPeriodId matches the week you’re looking at AND the statSourceId is 0 or 1. There are additional rows within stats, but again, ignore those if thescoringPeriodId does not match. We will write python code to handle this for us.
Like above, let’s go through an example for a specific player on a specific team. Here we are taking the team 1 (in row[0]) and player 1 (in row[0]):
# do it for a single player
team = espn_raw_data[‘teams’][0]
player = team[‘roster’][‘entries’][0]
player_name = player[‘playerPoolEntry’][‘player’][‘fullName’]
You now have a specific player. Next, loop over his stats to get his actual and projected points. Remember, you also need to skip the rows in stats where the scoringPeriodId does not match up to the week AND then find the appropriate statSourceId for the two columns.
for stats in player[‘playerPoolEntry’][‘player’][‘stats’]:
	# skip the rows where the scoring period does not match up with the curren week
    if stats[‘scoringPeriodId’] != week:
    	continue
    # if the source id = 0 then these are actual stats
    if stats[‘statSourceId’] == 0:
    	actual = stats[‘appliedTotal’]
    # if the source id = 1 then these are projected stats
    elif stats[‘statSourceId’] == 1:
    	projected = stats[‘appliedTotal’]
Nice! Now loop over all the players on an entire team.
team = espn_raw_data[‘teams’][0]
for player in team[‘roster’][‘entries’]:
	player_name = player[‘playerPoolEntry’][‘player’][‘fullName’]
    # get the projected and actual points
    projected = None,
    actual = None

    # loop over the stats for each player
    for stats in player[‘playerPoolEntry’][‘player’][‘stats’]:
    	# skip the rows where the scoring period does not match up with the curren week
        if stats[‘scoringPeriodId’] != week:
        	continue
        # if the source id = 0 then these are actual stats
        if stats[‘statSourceId’] == 0:
        	actual = stats[‘appliedTotal’]
        # if the source id = 1 then these are projected stats
        elif stats[‘statSourceId’] == 1:
        	projected = stats[‘appliedTotal’]
Great. You’re ready to loop over every team and every week. At the end of the for loop you need to append all the data to an empty projection_data list. Then convert that list to a dataframe.
# create an empty list to append data to
projection_data = []
for week in range(1, 15): #change this to 18 if you want to include the playoffs
	print(‘Week’,week)

    # get the raw data
    r = requests.get(url,
    				params={‘scoringPeriodId’: week},
                    cookies={“SWID”: swid, “espn_s2”: espn_s2})
    espn_raw_data = r.json()

    # loop over each team in the request
    for team in espn_raw_data[‘teams’]:
    	# get the team_id so we can map it to team_names
        team_id = team[‘id’]
        # create a new column with the team_abbrev using the team_id as the key
        team_owner = team_abbrev[team_id]
        # loop over every player on the teams roster
        for player in team[‘roster’][‘entries’]:
        	player_name = player[‘playerPoolEntry’][‘player’][‘fullName’]
            lineup_slot = player[‘lineupSlotId’]
            # create a new column with the position using the lineup_slot as the key
            position = eligible_positions[lineup_slot]
            # get the projected and actual points
            projected = None,
            actual = None
            # loop over the stats for each player
            for stats in player['playerPoolEntry']['player']['stats']:
            	# skip the rows where the scoring period does not match up with the curren week
                if stats['scoringPeriodId'] != week:
                	continue
                # if the source id = 0 then these are actual stats
                if stats['statSourceId'] == 0:
                	actual = stats['appliedTotal']
                # if the source id = 1 then these are projected stats
                elif stats['statSourceId'] == 1:
                	projected = stats['appliedTotal']
            # append all the data to the empty list
            projection_data.append([
            	week,
                team_owner,
                player_name,
                lineup_slot,
                position,
                projected,
                actual
                ])

print('Done getting projected & actual stats.')
Finally, take the projection_data list and convert it to a dataframe, passing in the data and column names to the columns parameter:
# convert the list to a dataframe with the following column names
df = pd.DataFrame(projection_data,
	columns=[‘Week’,
    		‘Team’,
            ‘Player’,
            ‘Lineup Slot’,
            ‘Position’,
            ‘Projected’,
            ‘Actual’])
# sample ten random rows of data
df.sample(10)
You’re 10 row sample output should look something along these lines:
Plotting Actual & Projected Data
Now that you have all the data nicely formatted in a pandas dataframe, you get to have some fun with it.
For the rest of this post let’s explore plotting the actual vs projected data for a specific team and compare which teams fared better or worse against ESPN’s weekly projections.
You’ll use matplotlib for creating some visuals. Seaborn is also a good option.
# import necessary modules for plotting
import matplotlib.pyplot as plt
To keep the data clean, you’ll want to only look at the starters each week. This means we need to filter out bench players so they don’t bias the data.
If you remember, each player carries a slotId which informs you where they are slotted on the roster in a given week. If they weren’t in the starting lineup, then they carried a slotId of 20 which indicates “Bench.” The good news is you already made this more readable so you can just filter every row out where position = “bench”:
# filter out the bench players for projection purposes
starters_df = df[~df[‘Position’].isin([‘Bench’])]
Save it into a new starters_df dataframe so you can keep the original df clean in case you need to access it again in the session.
You can clean it even further by using the .fillna() method. This will put a 0 wherever there are NULL values. This usually helps when trying to use groupby.
# fillna so we don’t hit any errors when grouping data
starters_df = starters_df.fillna(0)
# check a sample to make sure we don’t see any bench in positions
starters_df.sample(5)
Just like before, you can start with plotting one specific team’s season. To do this you’ll want to create another dataframe which filters the starter_df using the Team column. This example uses the champion team from 2021.
# filter down and select only the one teams starters
team_starters_df = starters_df[starters_df[‘Team’] == ‘HAN’]
Next you will use some basic matplotlib functionality to plot the ESPN projections and actual points each week to get a sense for how this team performed. Do this by grouping by week and summing the values:
# Select the ‘Week’ and ‘value’ columns from the groupby object
plot_data = team_starters_df[[‘Week’,’Projected’,’Actual’]].groupby([‘Week’]).sum().reset_index()
# Set the figure size and create the plot
plt.figure(figsize=(12, 6))
plt.plot(plot_data[‘Week’], plot_data[‘Projected’], ‘bo’, label=’Projected’)
plt.plot(plot_data[‘Week’], plot_data[‘Actual’], ‘ro’, label=’Actual’)
plt.plot(plot_data[‘Week’], plot_data[‘Projected’], ‘b-’)
plt.plot(plot_data[‘Week’], plot_data[‘Actual’], ‘r-’)
# Add a legend and show the plot
plt.title('Projected vs. Actual Points')
plt.legend()
plt.xticks(plot_data['Week'])
plt.show()
Your result should look something like this:
For the most part, it looks like this team outperformed projections on a weekly basis in the regular season. If you want to do this for other teams you can turn the plotting into a function and pass in the team name as a parameter.
# create a function to do it for each team
# this will only work with bench players filtered out
def plot_team(df, team_abbrev):
	# filter down and select only the one teams starters
    df2 = df[df[‘Team’] == team_abbrev]

    # Select the ‘Week’ and ‘value’ columns from the groupby object
    plot_data = df2[[‘Week’,’Projected’,’Actual’]].groupby([‘Week’]).sum().reset_index()
    # Set the figure size and create the plot
    plt.figure(figsize=(12, 6))
    plt.plot(plot_data['Week'], plot_data['Projected'], 'bo', label='Projected')
    plt.plot(plot_data['Week'], plot_data['Actual'], 'ro', label='Actual')
    plt.plot(plot_data['Week'], plot_data['Projected'], 'b-')
    plt.plot(plot_data['Week'], plot_data['Actual'], 'r-')
    # Add a legend and show the plot
    plt.title(team_abbrev +' Projected vs. Actual Points')
    plt.legend()
    plt.xticks(plot_data['Week'])
    plt.show()
To run it for another team, just include the dataframe and the team name like so:
plot_team(starters_df, ‘JABE’)Quantifying the Difference in Projections & Actuals
The charts are fun but you probably want some actual numbers so you can rank teams. First thing you’ll do is create a function which calculates the difference between the sum of the actual points and projected points.
# create a function to get the difference of projections and actuals
def calc_difference(df):
	return df[‘Projected’].sum() — df[‘Actual’].sum()
Then group the data however you want and apply this function. For example, if you want to get the season totals grouped by team we would run:
# use the starters df and groupby team and apply the function
team_df = starters_df.groupby([‘Team’]).apply(calc_difference)
Sorting and printing this would give you a good idea for which teams did performed better than ESPN projected and which teams performed worse.
In this case, since we are subtracting actual from projected in the calc_difference , negative numbers mean you were playing undervalued players while positive numbers means you weren’t getting the expected points that ESPN “experts” projected each week.
You could also break it down by week, position and even by player. Do this by grouping by different columns.
weekly_final_df = starters_df.groupby([‘Team’, ‘Week’]).apply(calc_difference)
position_df = starters_df.groupby([‘Team’, ‘Position’]).apply(calc_difference)
player_df = starters_df.groupby([‘Team’, ‘Player’]).apply(calc_difference)
You could also filter the dataframe down to a single team and break it down by player.
# just look at one team in particular
jabe_player_df = starters_df[starters_df[“Team”] == ‘JABE’].groupby([‘Player’]).apply(calc_difference)
My 2021 season looked like this:
ESPN just never got a handle on Fournette as he was a beast that season.
Advanced Plotting
For more detailed plotting options, make sure to check out stmorses blog posts and github repo. He walks you through some very cool plots like how to compare your actual points against your best optimal lineup that week.
I walk through this example and modify his code for my own league in my YouTube video.
Thanks for following along on this tutorial. Be sure to subscribe to my Learn With Jabe YouTube channel if you found this fun or helpful.
Cheers,
Jabe
New posts delivered to your inbox
Get updates whenever I publish something new. If you're not ready to smash subscribe just yet, give me a test drive on Twitter.